- Notice Type
- Authorities/Other Agencies of State
- Notice Title
-
ACC’s Levy Rate Consultation 2024: A Report on the Results for Levies Affecting New Zealand Businesses
- Notice Type
- Authorities/Other Agencies of State
- Publication Date
- 14 Mar 2025
-
Tags
-
Notice Number
- Title
- View PDF
- File Type and Size
- PDF (289 KB)
About this report
This report follows ACC’s public consultation on the levy rates that will be charged for the next three levy years (2025/26 to 2027/28)1, and details the Government’s final decisions on the rates in response to recommendations made by ACC.
Sections 331(5A) and 331(5B) of the Accident Compensation Act 2001 (“Act”) require the Accident Compensation Corporation (ACC) to prepare a report in relation to the rates of levies prescribed in regulations in accordance with generally accepted practice within the insurance sector in New Zealand.
If someone in New Zealand has an accident and ACC covers their injury, levies pay for and support their recovery. The levies are separate from general tax and are paid by all employers, employees, self-employed people, and people who own and drive vehicles.
- Employers and self-employed people pay their levies directly to ACC.
- Employees’ levies are deducted from their wages by their employers.
- People who own and drive vehicles pay their levies as part of the petrol they pay for at the pump and as part of their vehicle licence fees.
- Owners of non-petrol vehicles, eg. diesel or electric vehicles pay their entire levies when they license their vehicles.
The levies that people pay are calculated using percentages of their wages or payroll, or the number of vehicles they own, and the levies ACC collects are distributed among three ACC Accounts. Each Account covers the costs of a specific type of injury2.
We review the levy rates every three years and invite all levy payers to contribute their views on the proposed rates and other related proposals. We consider all the feedback we receive and present our recommendations for average levy rates to the Minister for ACC. The Government (via the Cabinet) then makes the final decisions on the levy rates and other proposals.
This report describes the impacts of the Government’s levy decisions on businesses, and a companion report focuses on the impacts on households. Both aim to help levy payers understand the link between ACC’s recommendations for future levy rates (which are determined by applying the Government’s ‘Funding Policy Statement’) and the Government’s final decisions. All levy projections in this report assume that recommendations under the Funding Policy Statement for levy years 2028/29 and beyond are followed.
Setting levies for the ACC Scheme
When setting levy rates we’re required to balance the ratio of ACC’s assets3 to its liabilities4 (the ‘funding position’) and the gap between the levies we charge and the costs of new injuries (the ‘funding gap’). When the assets and liabilities are balanced (a funding position of 100%), the levies we charge will equal the costs of new claims made by injured people (the funding gap will be $0), subject to capping rules.
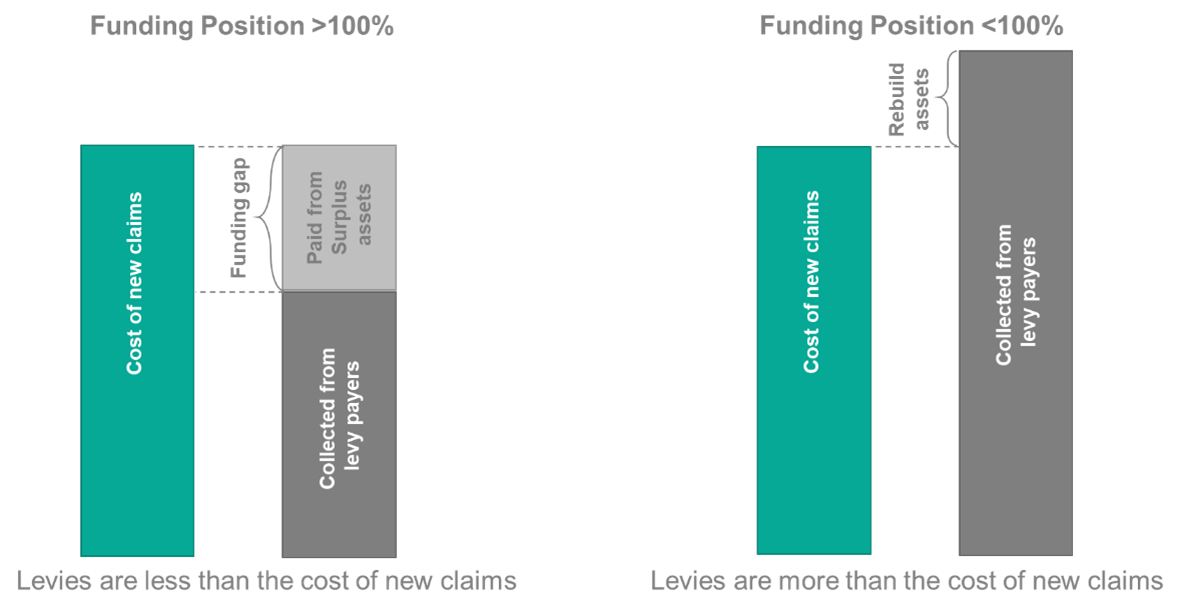
If an Account has surplus assets, the Funding Policy returns this surplus over a number of years through lower levy rates. However, over time, levy rates will still need to move towards new year costs to ensure we are collecting sufficient levy income when the surplus is exhausted.
Alternatively, if the funding position goes below 100%, the levies we charge need to be higher than the costs of new claims to reduce the shortfall.
The Funding Policy Statement is designed to ensure long-term stability in our levies
We apply the rules in the Funding Policy Statement when developing our recommendations for average levy rates. This ensures that we don’t overreact to economic fluctuations or ask levy payers in the future to keep paying for the injuries of today.
The Government can consider a wide range of factors when making the final decision on levy rates. However, in most situations, setting levy rates below those recommended by the Funding Policy Statement increases the risk that future levy payers will have to pay higher levy rates – either to avoid the Accounts becoming underfunded or because the Accounts are already underfunded and need to charge more than the cost of new claims to rebuild their asset levels.
Currently, a surplus of assets means levies are lower than the costs of claims
As at 30 June 2024, the funding positions of the Work Account and the Motor Vehicle Account were more than 100%. Given this, the average levy rates can be set lower than the actual cost of the expected injuries. The difference is funded from the surplus assets in each Account, which decrease over time as they’re used to fund the costs of claims. For the Scheme to remain sustainable, the gap between new year costs (lifetime cost of accidents incurred within a levy year) and levy income will need to reduce as the surplus assets decline.
The table below shows our projections, as at 30 June 2024, of the assets, claim costs, and funding positions of the Accounts at the beginning of each of the next three levy years.
|
Work Account |
Motor Vehicle Account |
|||||||
|
Year |
Accrued assets ($m) A |
Claim costs* ($m) B |
Net assets ($m) |
Funding ratio (A/B) |
Accrued assets ($m) |
Claim costs* ($m) |
Net assets ($m) |
Funding ratio |
|
2025/26 |
11,220 |
8,825 |
2,394 |
127% |
14,864 |
11,976 |
2,888 |
124% |
|
2026/27 |
11,339 |
9,273 |
2,066 |
122% |
15,150 |
12,578 |
2,572 |
120% |
|
2027/28 |
11,442 |
9,724 |
2,066 |
118% |
15,415 |
13,168 |
2,247 |
117% |
* The Outstanding Claims Liability (the future cost of claims the Account already has at the beginning of the year).
Influences and pressures on the levied Accounts funded by businesses
Since the last levy consultation in 2021, changes in the economy and claim costs have influenced the expected cost of new claims and the level of surplus assets in the Accounts. The table below details these changes and their effects on the Work and Motor Vehicle Accounts. More detailed information is available in the pricing reports released as part of the levy consultation.
|
Influences and pressures |
Work Account |
Motor Vehicle Account |
|
Higher claim costs |
Longer than expected rehabilitation for Weekly Compensation claims (people requiring time off work) partially offset by reduced volumes of Weekly Compensation Claims. |
|
|
Increases in the costs of serious-injury claims (ie, claims for injuries that cause long-term effects and disabilities, including spinal and traumatic brain injuries) offset by reduced volumes of claims requiring serious injury care. |
||
|
Increases in bulk-funded claim costs for emergency care. |
||
|
Discount rates and forecast investment returns |
The changes in discount rates5 and higher expected returns from our investments in the future decrease the amount that must be collected in levies to meet the future costs of claims. |
|
|
Current funding of Accounts |
In the past three years the funding positions of the levied Accounts (ie, the Work, Earners’ and Motor Vehicle Accounts) are weaker than expected meaning that more levy revenue needs to be collected. |
|
|
Inflation |
Higher than expected standard inflation forecasts increase the amount that must be collected in levies to meet the future cost of claims. |
|
|
Exposure |
Faster than expected growth in liable earnings, which forms the exposure base for the Account. This provides a broader base for the levy to be spread over reducing the levy rate per $100 of liable earnings. This is offset by growth in the cost of claims. |
Lower than expected growth in the number of vehicles in the fleet in New Zealand, which forms the exposure base for the account. Meaning that the levy paid per vehicle increases. |
Combined, these influences calculate the average levy rate needed to cover the costs of future injuries each year.
Although ACC had a surplus of funds as at 30 June 2024, the funding gap meant we recommended capped increases to both the Work Account levy and Motor Vehicle Account levy. Capping limits the size of the increases we can recommend, therefore, small, regular increases in the levy are necessary so the levy rate moves towards the new year costs over time as the surplus assets reduce.
Final (prescribed) levy rates
After considering advice from ACC and the Ministry of Business, Innovation and Employment, as well as feedback from levy payers, the Government decided to increase the average levy for the next three years in both the Motor Vehicle Account and Work Account in accordance with the recommendations of the Funding Policy Statement.
Where there is a surplus of money in an Account, levies can be set lower by using the surplus to pay for some of the cost of claims. A surplus does not stop levy rates going up as the amount of discount will reduce over time as the surplus is used up.
|
Account |
Year |
Funding Policy Statement |
Government decision |
Variance from Funding Policy Statement funding path |
|
Work levy (per $100 liable earnings) |
Current |
n/a |
$0.63 |
n/a |
|
2025/26 |
$0.66 |
$0.66 |
$0.00 |
|
|
2026/27 |
$0.69 |
$0.69 |
$0.00 |
|
|
2027/28 |
$0.72 |
$0.72 |
$0.00 |
|
|
Average Motor Vehicle levy (per vehicle) |
Current |
n/a |
$113.94 |
n/a |
|
2025/26 |
$122.84 |
$122.84 |
$0.00 |
|
|
2026/27 |
$131.94 |
$131.94 |
$0.00 |
|
|
2027/28 |
$141.69 |
$141.69 |
$0.00 |
The table below shows the impacts of the Government’s decisions on the annual costs of ‘typical’ businesses. It compares the current levy rates (2024/25) to the levy rates in 2027/28 to show the maximum impacts for businesses in the next three levy years.
|
Business |
Current (2024/25) levy |
Government decision (2027/28)* |
|
A small electrical business with 8 employees each earning $70,000, and a small vehicle fleet (3 petrol-driven cars, 3 diesel-driven utes/vans) |
$4,211 |
$4,637 |
|
A medium-sized architecture business with 35 employees (with an average individual income of $81,000) and 5 petrol-driven cars |
$3,329 |
$3,440 |
For petrol-driven vehicles these scenarios cover the vehicle licencing costs only, petrol-driven vehicles are also subject to a levy on petrol.
*The Government’s levy decisions were aligned with ACC’s recommendations under the Funding Policy Statement.
While the average Work levy will increase at the maximum allowable under the Funding Policy Statement in the 2025/26 to 2027/28 period, the levy rate for each classification unit will be updated to reflect any changes in its claim patterns. This means that the levy rates for some businesses will decrease when the average rate is increasing, while levy increases for others may be less or more than the average movement indicates. This will allow classification units to move towards fair rates that accurately reflect their risk profiles over time.
Long-term impacts on businesses
Appendices A and B describe the long-term projections and key assumptions for the Work and Motor Vehicle Accounts. For example, they show our forecast that levies will need to continue increasing in future levy rounds to ensure that we collect enough money to support the total costs of new injuries. This will mean we don’t have to pass on the costs to future generations, no matter how long a person needs our support.
|
Long term levy rate projections |
|||
|
The Work levy will need to increase from |
$0.72 (per $100 liable earnings) in 2028 |
… to $1.06 by 2036/37 |
… a 47% increase |
|
The average Motor Vehicle levy will need to increase from |
$141.69 (per vehicle) in 2028 |
… to $267.60 by 2036/37 |
… an 89% increase |
The Funding Policy Statement has a key role in smoothing out these pressures and ensuring that levies aren’t too reactive. Making small increases to levy rates helps keep levies stable and sustainable and avoids future generations having to face significantly higher increases. However, we know that many businesses are doing it tough in the current economic climate. Mitigating these impacts by improving rehabilitation performance is a priority for ACC.
Changing economic conditions can have serious effects on Account funding
The funding amounts in our Accounts are sensitive to economic changes and also depend on our investment performance.
This sensitivity has been demonstrated in the past three years:
- In 2022 and 2024, ACC recorded annual deficits of $49 million and $7.2 billion respectively, largely because of increases in the Outstanding Claims Liability (the remaining lifetime cost of accidents which have already occurred).
- In contrast, for the year ended 30 June 2023 we reported a surplus of $991 million, mainly the result of growth in ACC’s Investment Fund.
The projections used for the 2024 levy consultation, and this report, applied assumptions as at 30 June 2024. Changes in the economy and claims experience in the six months since have had a small positive impact on the funding positions of the Accounts. This wouldn’t result in any change to the levy rates 2025/26 to 2027/28 levy years, calculated under the Funding Policy Statement.
As of 31 December 2024, updated projections of the Accounts funding ratios at the commencement of the 2026 levy year see:
- the projected funding ratio for the Work Account (at 31 March 2025) increased to 129% (from 127%)
- the projected funding ratio of the Motor Vehicle Account (at 30 June 2025) increased to 127% (from 124%).
Appendix A: Work Account
Long-term projections for the Work Account, as at 30 June 2024
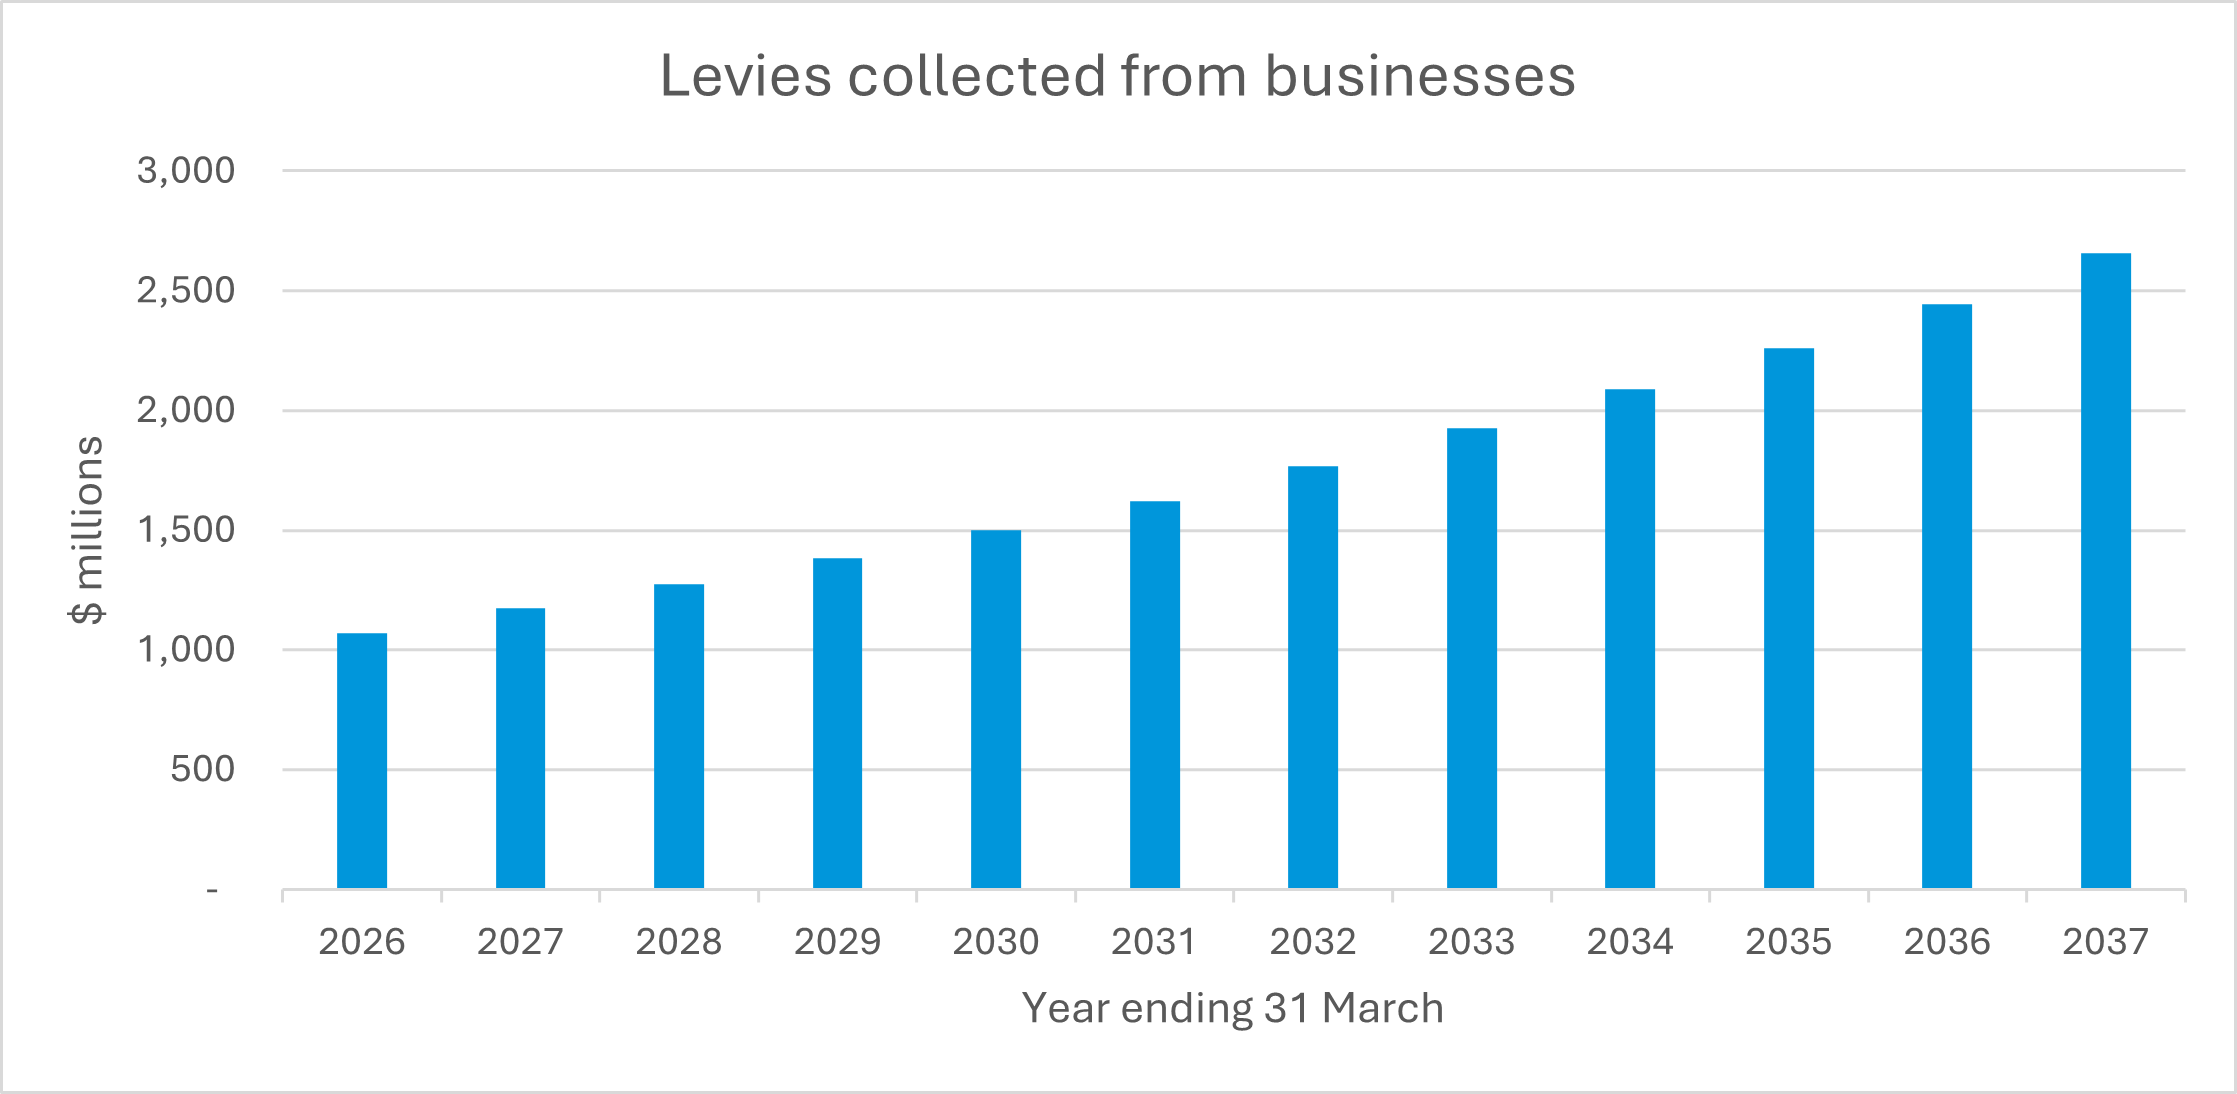
We expect we’ll need to collect $1.54 billion from businesses to support the lifetime costs of work injuries anticipated in 2025/26.
In the first three years, 29% of the required levy will come from the use of surplus assets. As the asset levels reduce, more will have to be funded by levy payers. The graph below shows the projected contribution from levy payers as surplus assets are used.
The table below shows how we expect the Outstanding Claims Liability (the remaining lifetime cost of accidents which have already occurred) and assets (our investments and cash reserves) to change in the next 12 years. The funding ratio is expected to drop below 100% towards the end of the forecast period as assets are used to fund the cost of injuries. Over the period asset levels are projected to move from a $2.394 billion surplus to a $945 million deficit.
|
Position at the start of the levy year |
||||
|
Year ending 31 March |
Accrued assets ($m) |
Outstanding Claims Liability ($m) |
Net assets (accrued assets – OCL) ($m) |
Funding ratio |
|
2026 |
11,220 |
8,825 |
2,394 |
127% |
|
2027 |
11,339 |
9,273 |
2,066 |
122% |
|
2028 |
11,442 |
9,724 |
1,717 |
118% |
|
2029 |
11,556 |
10,183 |
1,373 |
113% |
|
2030 |
11,682 |
10,672 |
1,010 |
109% |
|
2031 |
11,833 |
11,186 |
647 |
106% |
|
2032 |
12,012 |
11,743 |
269 |
102% |
|
2033 |
12,248 |
12,329 |
-81 |
99% |
|
2034 |
12,553 |
12,939 |
-386 |
97% |
|
2035 |
12,933 |
13,570 |
-637 |
95% |
|
2036 |
13,398 |
14,225 |
-826 |
94% |
|
2037 |
13,955 |
14,901 |
-945 |
94% |
The table below shows the 12-year forecast for levy rates, new year claims costs, administration costs, and the subsequent funding adjustment.
|
Levy required to fund lifetime costs (per $100 liable earnings) |
||||
|
Year ending 31 March |
Levy rates ($) |
New-year claim costs only ($) |
Administration costs ($) |
Funding adjustment ($) |
|
2026 |
0.66 |
0.73 |
0.15 |
-0.22 |
|
2027 |
0.69 |
0.76 |
0.14 |
-0.21 |
|
2028 |
0.72 |
0.77 |
0.14 |
-0.19 |
|
2029 |
0.75 |
0.78 |
0.14 |
-0.18 |
|
2030 |
0.78 |
0.79 |
0.14 |
-0.16 |
|
2031 |
0.81 |
0.81 |
0.15 |
-0.14 |
|
2032 |
0.85 |
0.81 |
0.15 |
-0.11 |
|
2033 |
0.89 |
0.81 |
0.14 |
-0.07 |
|
2034 |
0.93 |
0.81 |
0.14 |
-0.03 |
|
2035 |
0.97 |
0.81 |
0.14 |
0.01 |
|
2036 |
1.01 |
0.82 |
0.14 |
0.05 |
|
2037 |
1.06 |
0.82 |
0.14 |
0.10 |
Key assumptions for the Work Account, as at 30 June 2024
To calculate the projected levy-rate charges for businesses, ACC makes a set of assumptions based on forecasts from other government agencies and private-sector advice. We expect that, in the next 12 years:
- investment returns will remain stable, with standard inflation continuing to abate before stabilising
- the severity of injuries for which people claim weekly compensation will increase in line with our recent claim experience. This largely reflects a deterioration in clients’ rehabilitation rates in the first few years after their accidents.
|
Year ending 31 March |
Total claim numbers |
Entitlement claim numbers |
Exposure (Number of workers not covered by the Accredited Employer Programme) (000) |
Exposure (liable earnings) ($b) |
Investment return forecasts (June year) |
Risk-free interest rates (June year) |
Standard inflation (Labour Cost index) (June year) |
|
2025 |
175,754 |
31,509 |
2,536 |
167 |
6.16% |
5.30% |
2.52% |
|
2026 |
174,995 |
32,593 |
2,578 |
175 |
5.62% |
4.49% |
2.30% |
|
2027 |
175,228 |
33,869 |
2,625 |
183 |
5.46% |
4.25% |
2.28% |
|
2028 |
175,738 |
35,156 |
2,655 |
191 |
5.52% |
4.34% |
2.24% |
|
2029 |
175,799 |
36,335 |
2,686 |
199 |
5.60% |
4.46% |
2.21% |
|
2030 |
175,679 |
37,538 |
2,715 |
208 |
5.71% |
4.62% |
2.21% |
|
2031 |
175,442 |
38,713 |
2,743 |
216 |
5.83% |
4.80% |
2.21% |
|
2032 |
176,177 |
39,304 |
2,770 |
225 |
5.97% |
5.01% |
2.21% |
|
2033 |
177,725 |
39,649 |
2,794 |
234 |
6.08% |
5.17% |
2.21% |
|
2034 |
179,157 |
39,969 |
2,817 |
243 |
6.14% |
5.28% |
2.21% |
|
2035 |
180,475 |
40,263 |
2,839 |
252 |
6.14% |
5.34% |
2.21% |
|
2036 |
181,695 |
40,535 |
2,858 |
261 |
6.14% |
5.36% |
2.21% |
|
2037 |
182,830 |
40,789 |
2,876 |
271 |
6.14% |
5.36% |
2.21% |
|
Trend in Underlying Costs |
Prescribed 2024/25 levy rate |
Previous levy indication 2025/26 |
Prescribed 2025/26 levy rate |
Prescribed 2026/27 levy rate |
Prescribed 2027/28 levy rate |
|
To fund the cost of new claims during the new levy year (excluding admin costs) |
$0.73 |
$0.73 |
$0.73 |
$0.76 |
$0.77 |
|
To fund administration costs |
$0.18 |
$0.19 |
$0.15 |
$0.14 |
$0.14 |
|
Total net benefits of ICIP and IP (new year cost and funding adjustment) |
-$0.03 |
-$0.04 |
|||
|
Funding adjustment |
-$0.24 |
-$0.22 |
-$0.22 |
-$0.21 |
-$0.19 |
|
Average Work levy rate |
$0.63 |
$0.66 |
$0.66 |
$0.69 |
$0.72 |
*Figures in this table have been rounded and therefore may not appear to add up exactly
Appendix B: Motor Vehicle Account
Long-term projections for the Motor Vehicle Account, as at 30 June 2024
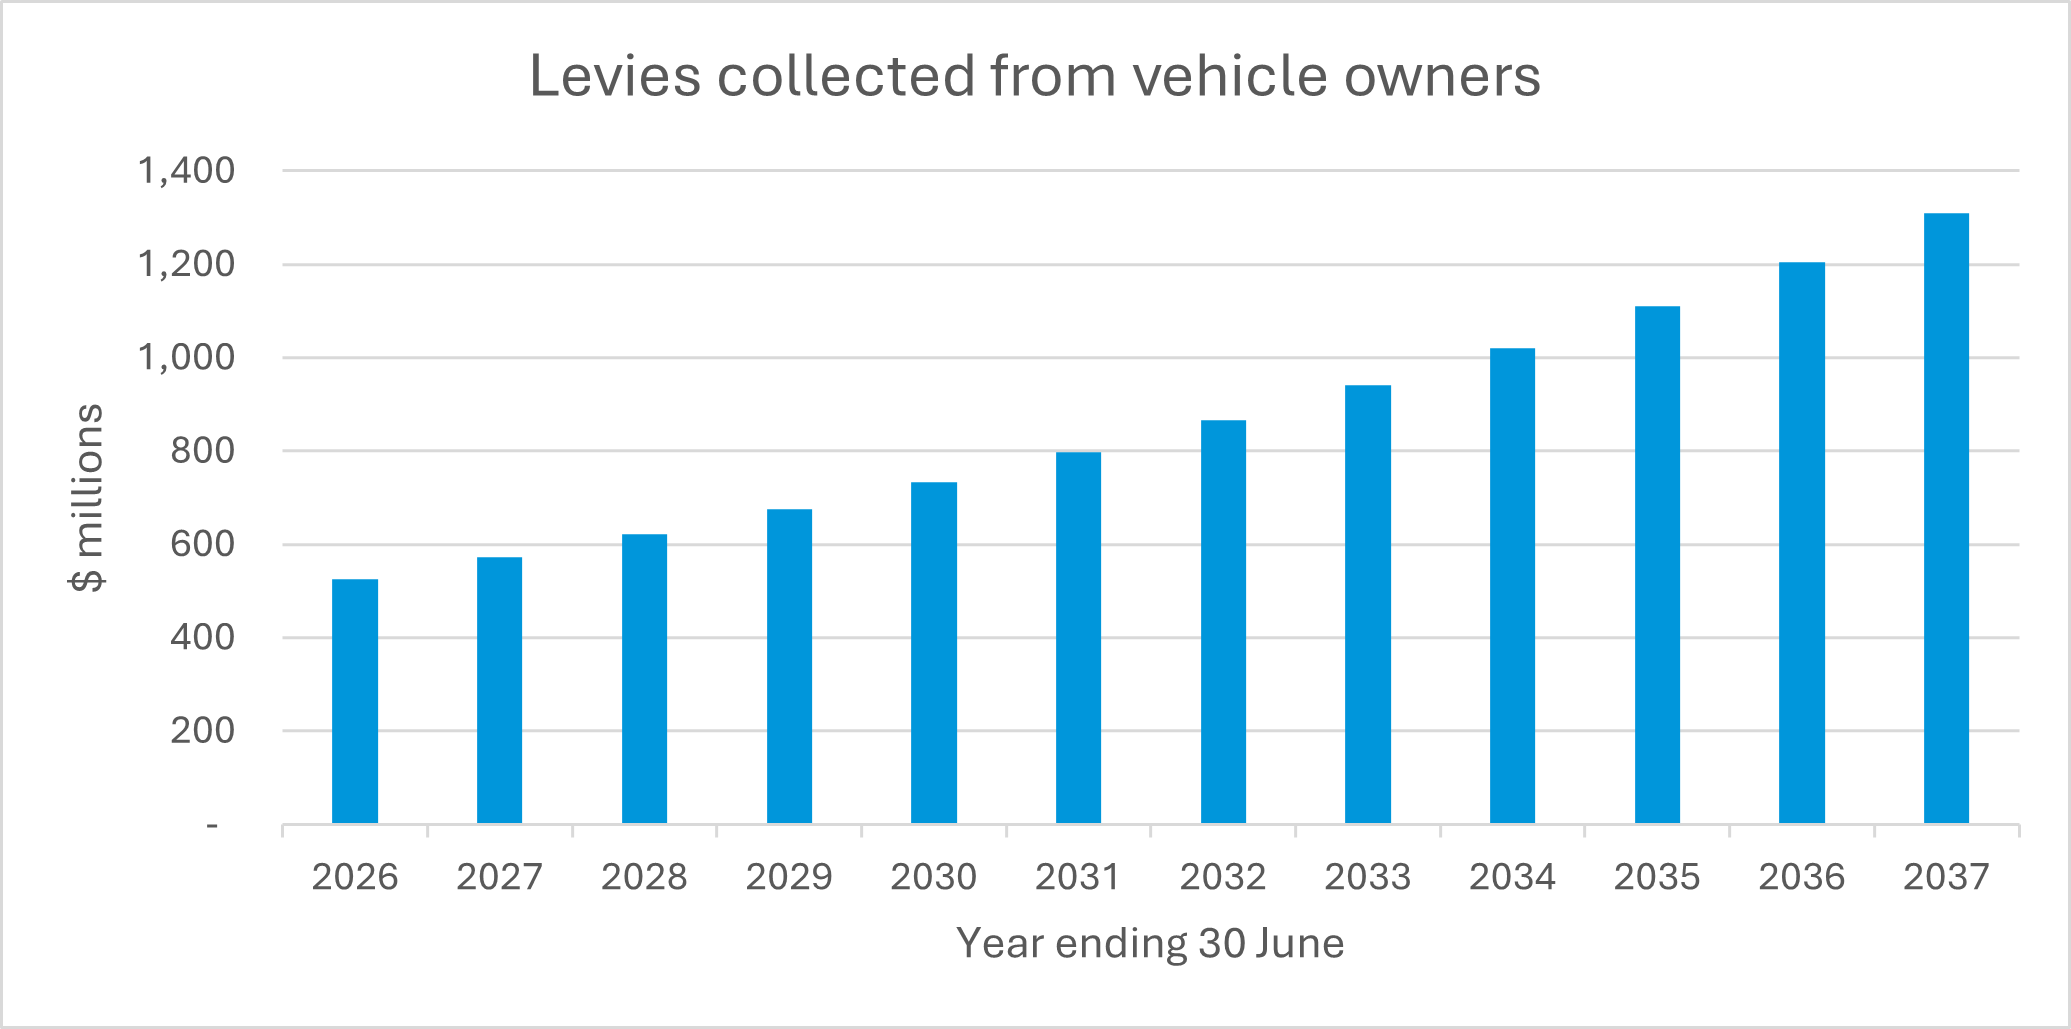
We expect we’ll need to collect $999 million from vehicle owners to support the lifetime costs of the road injuries that are anticipated to happen in 2025/26.
In the first three years, 45% of the levy required will come from the use of surplus assets. As the asset levels reduce, more will need to be funded by levy payers. The graph below shows the projected contributions from levy payers as surplus assets are used up.
The table below shows how we expect the Outstanding Claims Liability (the remaining lifetime cost of accidents which have already occurred) and assets (our investments and cash reserves) to change in the next 12 years. The funding ratio is expected to drop below 100% towards the end of the forecast period as assets are used to fund the cost of injuries. Over the period asset levels are projected to move from a $2.888 billion surplus to a $1.059 billion deficit.
|
Position at the start of the levy year |
||||
|
Year ending 30 June |
Accrued assets ($m) |
Outstanding Claims Liability ($m) |
Net assets (accrued assets - OCL) ($m) |
Funding ratio |
|
2026 |
14,864 |
11,976 |
2,888 |
124% |
|
2027 |
15,150 |
12,578 |
2,572 |
120% |
|
2028 |
15,415 |
13,168 |
2,247 |
117% |
|
2029 |
15,694 |
13,781 |
1,912 |
114% |
|
2030 |
15,988 |
14,419 |
1,569 |
111% |
|
2031 |
16,319 |
15,101 |
1,217 |
108% |
|
2032 |
16,689 |
15,832 |
857 |
105% |
|
2033 |
17,108 |
16,621 |
487 |
103% |
|
2034 |
17,575 |
17,465 |
110 |
101% |
|
2035 |
18,083 |
18,358 |
-275 |
99% |
|
2036 |
18,639 |
19,307 |
-668 |
97% |
|
2037 |
19,245 |
20,304 |
-1,059 |
95% |
The table below shows the 12-year forecast for levy rates, new year claims costs, administration costs, and the subsequent funding adjustment.
|
Levy required to fund lifetime costs (average per vehicle) |
||||
|
Year ending 31 March |
Levy rates ($) |
New-year claim costs only ($) |
Administration costs ($) |
Funding adjustment ($) |
|
2026 |
122.84 |
214.19 |
18.98 |
-110.33 |
|
2027 |
131.94 |
221.37 |
19.07 |
-108.51 |
|
2028 |
141.69 |
227.93 |
19.53 |
-105.77 |
|
2029 |
152.10 |
234.71 |
20.02 |
-102.63 |
|
2030 |
163.23 |
241.53 |
20.55 |
-98.85 |
|
2031 |
175.17 |
248.73 |
21.14 |
-94.69 |
|
2032 |
187.99 |
256.25 |
21.81 |
-90.07 |
|
2033 |
201.75 |
264.14 |
22.49 |
-84.88 |
|
2034 |
216.51 |
272.50 |
23.14 |
-79.13 |
|
2035 |
232.35 |
281.27 |
23.72 |
-72.64 |
|
2036 |
249.35 |
290.31 |
24.32 |
-65.29 |
|
2037 |
267.60 |
299.64 |
24.94 |
-56.98 |
Key assumptions for the Motor Vehicle Account, as at 30 June 2024
In calculating the projected levy rates for vehicle owners, ACC makes assumptions based on forecasts from other government agencies and private-sector advice.
We expect growth in the cost of claims driven by increases in the severity of Motor Vehicle Account claims, taking more time to rehabilitate and serious injuries costing more.
|
Year ending 30 June |
Total claim numbers |
Entitlement claim numbers |
Exposure (number of vehicles) (000) |
Exposure (petrol million litres) |
Investment return forecasts (June year) |
Risk-free interest rates (June year) |
Standard inflation (Labour Cost Index June year) |
|
2025 |
28,465 |
7,446 |
4,235 |
2,984 |
5.95% |
5.30% |
2.52% |
|
2026 |
28,421 |
7,562 |
4,286 |
2,970 |
5.34% |
4.49% |
2.30% |
|
2027 |
28,324 |
7,681 |
4,337 |
2,943 |
5.16% |
4.25% |
2.28% |
|
2028 |
28,257 |
7,779 |
4,390 |
2,917 |
5.23% |
4.34% |
2.24% |
|
2029 |
28,236 |
7,884 |
4,442 |
2,890 |
5.32% |
4.46% |
2.21% |
|
2030 |
28,163 |
7,979 |
4,496 |
2,863 |
5.44% |
4.62% |
2.21% |
|
2031 |
28,093 |
8,081 |
4,551 |
2,822 |
5.58% |
4.80% |
2.21% |
|
2032 |
28,286 |
8,184 |
4,606 |
2,769 |
5.73% |
5.01% |
2.21% |
|
2033 |
28,630 |
8,283 |
4,662 |
2,715 |
5.85% |
5.17% |
2.21% |
|
2034 |
28,979 |
8,384 |
4,719 |
2,661 |
5.92% |
5.28% |
2.21% |
|
2035 |
29,332 |
8,486 |
4,776 |
2,594 |
5.92% |
5.34% |
2.21% |
|
2036 |
29,688 |
8,589 |
4,835 |
2,513 |
5.92% |
5.36% |
2.21% |
|
2037 |
30,050 |
8,694 |
4,893 |
2,433 |
5.92% |
5.36% |
2.21% |
The exposure base in the Motor Vehicle Account is based on the numbers of vehicles so doesn’t increase with inflation like the other levied accounts (Earners’ and Work). This means more of the increases in costs need to be passed through to levy rates.
|
Trend in Underlying Costs |
Prescribed 2024/25 levy rate |
Previous levy indication 2025/26 |
Prescribed 2025/26 levy rate |
Prescribed 2026/27 levy rate |
Prescribed 2027/28 levy rate |
|
To fund the cost of new claims during the new levy year (excluding admin costs) |
$213.69 |
$219.33 |
$214.19 |
$221.37 |
$227.93 |
|
To fund administration costs |
$17.47 |
$19.67 |
$18.98 |
$19.07 |
$19.53 |
|
Total net benefits of ICIP and IP (new year cost and funding adjustment) |
-$9.20 |
-$9.77 |
|||
|
Funding adjustment |
-$108.02 |
-$107.12 |
-$110.33 |
-$108.51 |
-$105.77 |
|
Average Motor Vehicle levy rate |
$113.94 |
$122.12 |
$122.84 |
$131.94 |
$141.69 |
*Figures in this table have been rounded and therefore may not appear to add up exactly
Endnotes
1. A levy year starts on 1 April and ends on 31 March for employees and businesses; for vehicle owners the levy years starts 1 July and ends 30 June.
2. This report applies to the ‘Work Account’, which funds cover for injuries that happen to people at work, and the ‘Motor Vehicle Account’, which funds cover for people injured by motor vehicles on public roads. The third account, the ‘Earners’ Account’ funds cover for injuries that happen to workers outside work. The Government funds treatment for injured people who are not in the workforce (eg, children and retirees) and partially funds the costs of supporting people injured while receiving treatment.
3. ‘Assets’ are the funds that ACC has on hand and in investments to pay for the costs of supporting people to recover from their injuries.
4. ‘Liabilities’ are identified via an assessment of the future costs of injuries that occurred between 1974 and a set date (usually the end of a financial year) and that we’re still required to cover.
5. A discount rate is a rate that turns a future cost into today’s dollars.